Beyond vector tiles: Mapbox, MapLibre or DeckGL for my 3D map?
Unfortunately, there is no magic recipe for this answer, but this post will discuss in depth the pros and cons of vector tiles, Mapbox, MapLibre and DeckGL. Geomatico is a company that has been working on web mapping and advanced visualizations for many years (some nice examples in our showcase: https://labs.geomatico.es).

MapLibre or MapboxGL?
On December 2020, Mapbox announced that the version 2 of MapboxGL went from BSD to proprietary. Almost immediately, a new open source project was released, with the name of Maplibre.
At first, MapLibre didn’t support 3D terrain, but the release of version 2 of MapLibre brought this key feature to the project.

At Geomatico we love open source, so we (almost) always choose MapLibre. It is a mature project and provides all the functionality our clients crave for.
Need interactivity in massive datasets? DeckGL
Deck.gl is a framework for visualization, animation and 3D editing of large volumes of data (up to millions of points), in the browser, with optimal performance thanks to WebGL technology and the computing power of the GPU.
It is prepared to work seamlessly with WebGL based map libraries such as MapLibre GL JS, Mapbox GL JS or Google Maps. It extends their capabilities with a large number of formats, data types and layer visualizations, such as point clouds (tessellated or not), real 3D vector data, 3D models, on-the-fly clustering, trip animations, GPU filtering, etc.
The deck.gl code is not only free, but designed with extensibility in mind, making it very easily customizable.
Vector tiles (only?) for basemaps
For beautiful base maps, don’t hesitate with the format … vector tiles and a cartographer with good taste.
Vector tiles were created for that: fast rendering with great quality and amazing beauty. Perfect for base layers!
But what about data layers? Especially if you have massive datasets and need to filter and animate with good performance and interactivity …
Sometimes the simplest approach works
If we have simple geographic data (Ex: points) and the dataset is not huge, a GeoJSON can be fine. The simplification at higher zooms brought by vector tiles is useless … and you get GeoJSON out-of-the-box thanks to Geoserver!
Just make sure to serve the GeoJSON g-zipped … size decreases dramatically.
Points with lots of attribute data : let’s cook the data!
When we have point data, vector tiles are rarely the best choice. But if there are hundreds of MB of data, a GeoJSON is not possible … or is it? Before trying a more complex architecture, take a look at the data: can you simplify it? Maybe we can remove some unnecessary attributes? Or use dictionaries? Do we really need eight decimal digits (spoiler: we don’t)?

Once we have light data, and we combine it with DeckGL … the interactivity and performance skyrockets. In this biodiversity world map, we get an instant loading of a dataset of 200,000 points with GPU filtering, providing interactivity and refresh rates far beyond the ones offered by Mapbox or MapLibre.
GeoArrow: an alternative for big datasets
Your GeoJSON is so big Javascript cannot parse it? Then don’t use Javascript!
Geoarrow provides a library to load data directly on your GPU, avoiding expensive parsing from text to javascript, and from row-based to column-based data arrays for the GPUs.
Polygons and even more attribute data: OK, let’s build a backend
We love making websites that have 100% of the logic on the client side. But life is not perfect, and sometimes we need a backend.
We then use plain MVT tiles for geometries with only the identifier as attribute, and a REST API for the alphanumeric data. Remember to make the tiles as light as possible (let’s cook the data!).
In this information system for precision irrigation: in a region of 300,000 plots (polygons), we show animated time series of evapotranspiration data, vegetative vigor, or water needs during an annual cycle. The indicators we can show on our map:
- 450.000 plot states x 14 indicators = 6.3 million
- 22.000.000 plot records x 11 indicators = 242 million
- 4.700.000 plot forecasts x 6 indicators = 28.2 million
In total more than 275 million ways of showing the data!
Editing real 3D
Editing 2D geometries has been a well-known feature of many GIS libraries for many years. But what about 3D?
Nebula.gl is a library on top of Deck.gl that allows high performance editing. We have successfully customized it for in-browser applications that allow 3D editing over terrain surface models. Add visualization of point clouds, textures, profiles, contour lines and other vector cartography in 3D, and you have a full web 3D editor that can replace legacy and expensive desktop applications.
Do you have a project idea and want to turn it into reality? We would like to hear from you, tell us about it
The facts define us
-
Real-time public transportation visualization
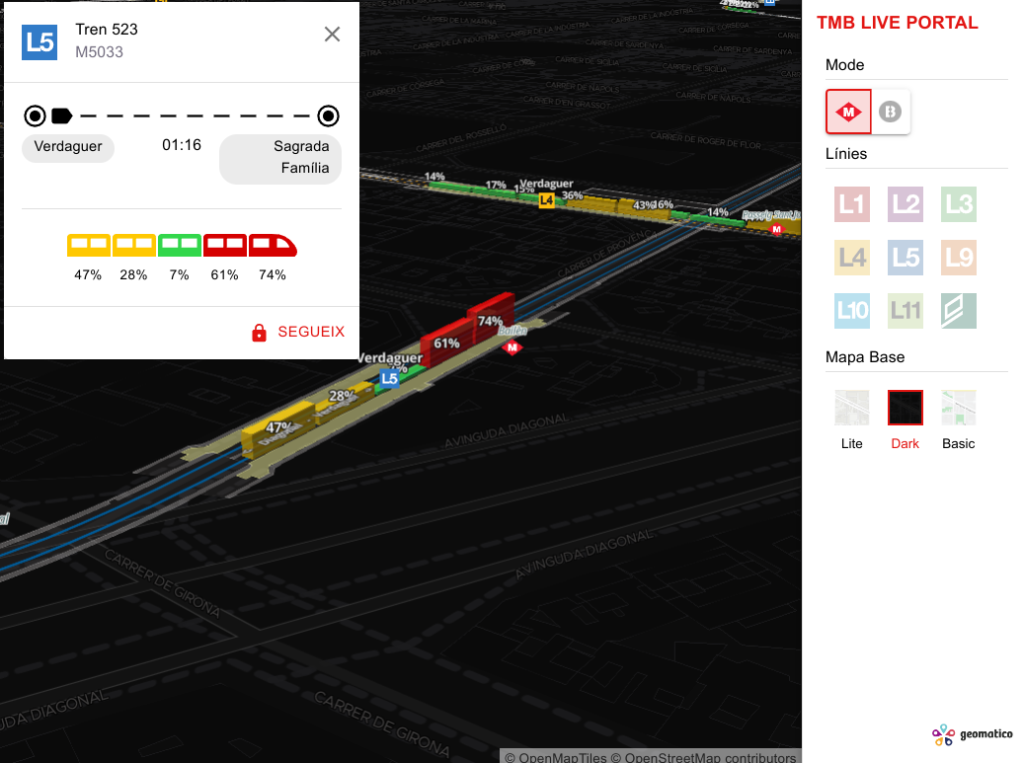
https://vimeo.com/540079821/ Real-time visualization for the Barcelona metro and bus services Since 2016, Geomatico has been working with the Barcelona public transport agency (Transports Metropolitans de Barcelona, TMB) for GIS development…
-
Beyond vector tiles: Mapbox, MapLibre or DeckGL for my 3D map?
Unfortunately, there is no magic recipe for this answer, but this post will discuss in depth the pros and cons of vector tiles, Mapbox, MapLibre and DeckGL. Geomatico is a…
-
Irriter: precision irrigation visualization
http://vimeo.com/736100341 Software development for precision irrigation Irriter is an information system to help the irrigators of the Baix Ter. It is based on crop information, soil type and satellite imagery…
-
Serverless rasters in MapLibre: the COG protocol extension
After our talk at FOSS4G about vector tiles and Deck.gl, an audience member raised an interesting question: we have the tools to publish and analyze vector data directly in the…

